

Dashboard
Build analyst dashboards from SQL widgets over SandsBytes tables.
Dashboard
The Dashboard (/UI/dashboard/list) is the home workspace after sign-in. Each dashboard is a set of widgets. A widget runs a SQL query against platform tables and renders the result as a number, table, or chart.
Open it from Dashboard in the sidebar. The selector at the top of the workspace shows the active dashboard (for example Analyst Workspace). The footer of the application shows the product version.
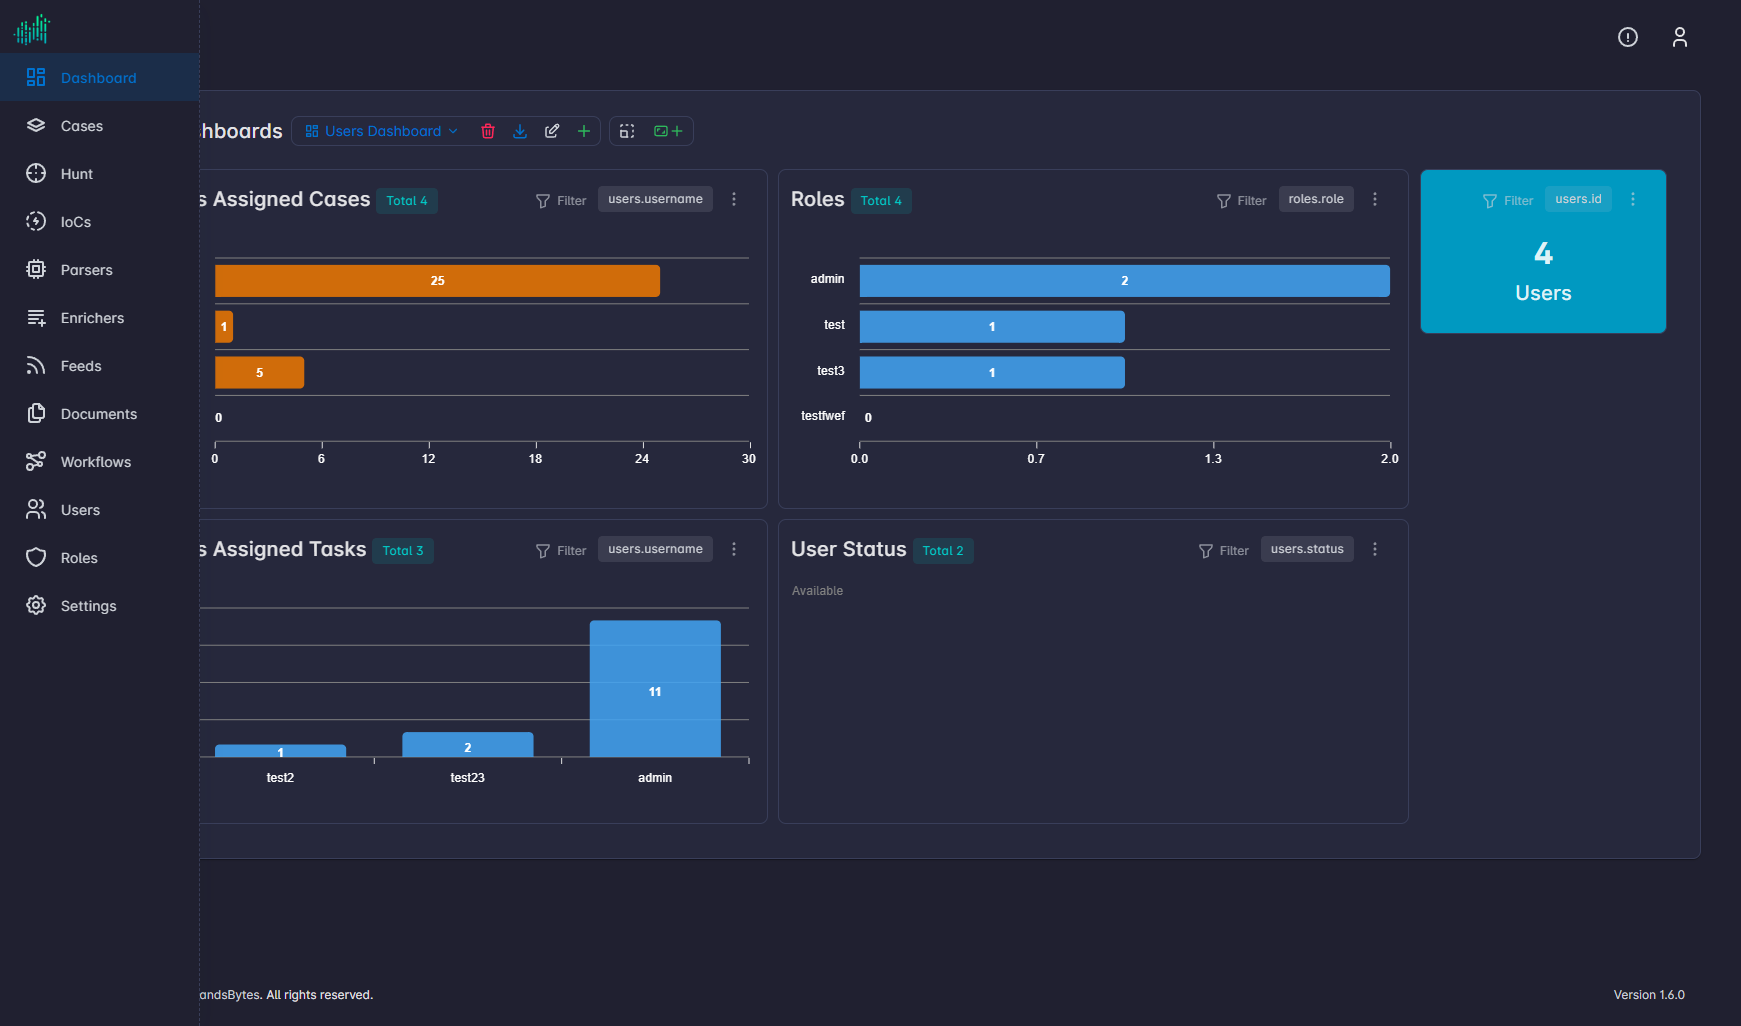
Manage dashboards
| Action | What it does |
|---|---|
| Create Dashboard | Starts a new empty dashboard. |
| Edit Dashboard | Renames the current dashboard or changes its settings. |
| Delete Dashboard | Removes the current dashboard. |
| Download Dashboard | Exports the dashboard definition. |
| Enable Edit Widget | Unlocks widget layout so widgets can be rearranged. |
| Create Widget | Opens the two-step widget wizard. |
| Refresh | Reloads widget data. |
| Auto-refresh | Repeats refresh on a timer. The default is Off. |
Create a widget
Create Widget opens a wizard with two steps: Query, then Chart.
Query
| Field | Purpose |
|---|---|
| Title | Label shown on the widget. |
| Table | Platform table the query reads. Choosing a table fills schema help for that table. |
| Schema | Columns available on the selected table. |
| Runtime variables | Placeholders substituted at run time. user_id is available as {{ user_id }} and is the signed-in user. |
| Preview user id | User id used when you click Run so the preview can resolve {{ user_id }}. |
| SQL Query | Statement to execute. A new widget starts from a count of cases created by the current user. |
| Run | Executes the SQL and fills Results Preview. |
Example:
SELECT COUNT(*) AS n FROM cases WHERE created_by_id = {{ user_id }}Widgets can query case, task, finding, evidence, file, package, parser, enricher, feed, document, user, role, workflow, processing, lookup, dashboard, custom field, SMTP, and API key tables, among others. Pick the table in the wizard to see its columns.
Chart
Next opens the Chart step. Choose how the preview rows are drawn (metric, table, or chart) and save the widget. Return to the dashboard and use Refresh to load live data.
SQL is not the list filter
Dashboard widgets use SQL and {{ user_id }}. List pages, enricher queries, and rule conditions use the JSON filter spec described in Filter Queries.
What a default workspace shows
A new analyst workspace typically includes widgets such as:
- Processing in progress
- My cases, including critical and high open cases
- My open cases and open cases by severity
- My cases by status
- Cases opened in the last 30 days
- Failed files over the last 7 days
- My active cases
- My pending tasks
These are ordinary widgets. Edit or replace them with Enable Edit Widget and Create Widget.